
Introducing views: customizable data dashboards for every ride
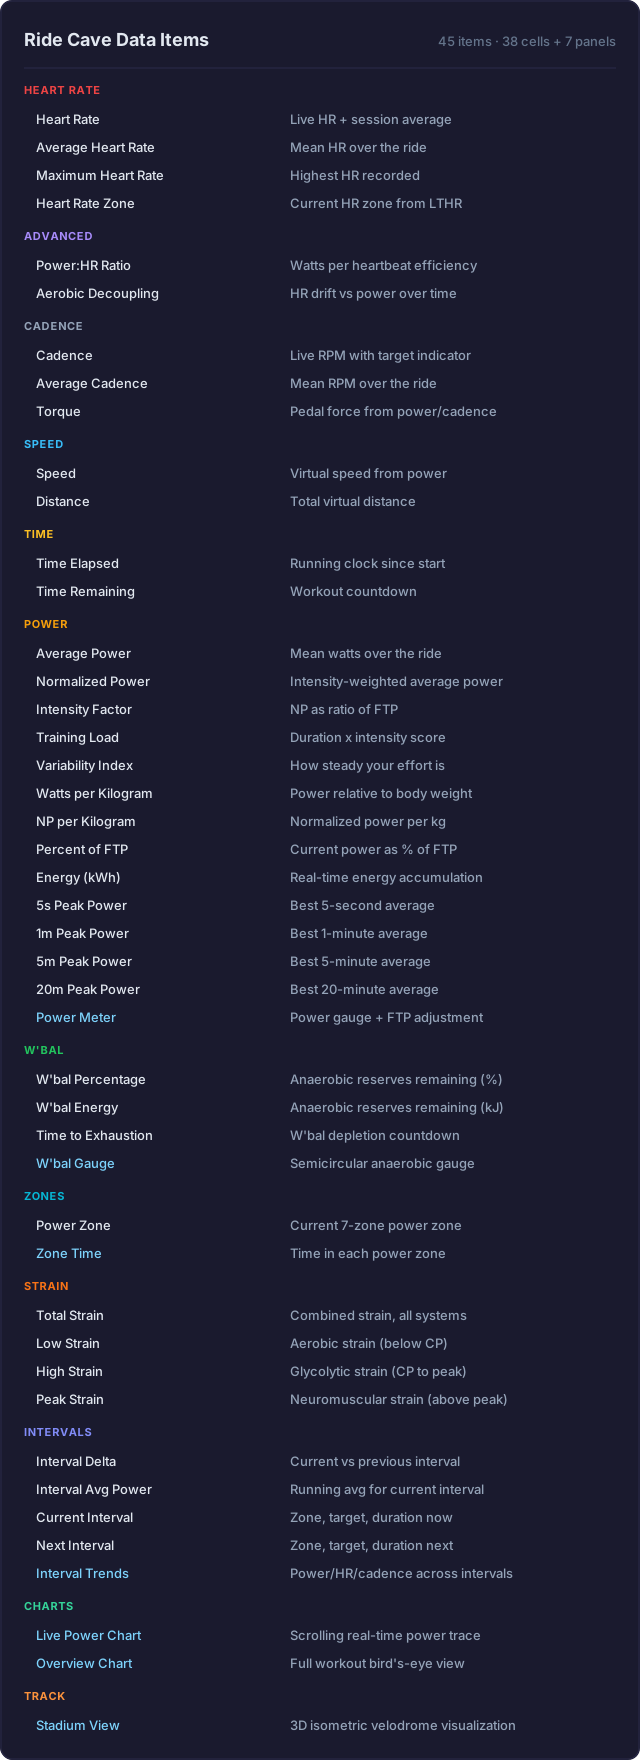
Choose from over 45 data fields—including real-time strain decomposition—arrange them however you want, and switch layouts mid-ride. Views give you full control over what you see during workouts and group rides.
Every cyclist cares about different numbers. A racer wants W'bal and peak power front and center. Someone building their base wants heart rate drift and zone distribution. An interval junkie needs current and next targets at a glance. Until now, everyone got the same fixed layout. Views change that.
What Views Are
A view is a custom data dashboard you build from the fields you care about, arranged across up to four panels. Each panel can display a full-size visualization—like a live power chart or W'bal gauge—or a grid of up to six data cells. Save as many views as you want and switch between them mid-ride from the player header with a single click.
Over 45 Data Fields
Views ship with over 45 data fields spanning twelve categories—from power and heart rate basics to advanced metrics like strain decomposition, aerobic decoupling, and W'bal time to exhaustion. Full-panel visualizations include live power charts, a W'bal gauge, zone time distribution, interval trends, and a 3D stadium view.
Works for Workouts and Group Rides
Views work the same in solo workouts and group sessions—your view stays put while the group panel handles the social side. Build one view for interval days, another for endurance rides, and a third for race efforts. Star your favorites and switch mid-ride with a single click.
Share With the Community
Make any view public and it appears in the Discover tab for other riders to browse, star, and clone. Found a layout you like? Clone it to your collection and customize it however you want.
New Data on Ride Summaries
These metrics carry over to your ride summary, which now includes average, max, and normalized power, intensity factor, variability index, watts per kilogram, and notable peak powers at 5-second, 1-minute, 5-minute, and 20-minute durations. A color-coded bar shows time in each of the seven power zones. Tap any metric for a detailed explanation.
Strain Decomposition
Strain decomposition splits your total training load into three buckets by energy system. Low Strain tracks aerobic work below Critical Power—your endurance engine. High Strain covers the glycolytic range between Critical Power and Peak Power—threshold and VO2max efforts. Peak Strain tracks neuromuscular work above Peak Power—explosive sprints and attacks.
To set up strain, enter your Peak Power in Settings alongside your FTP and W' values. If unsure, six times your FTP is a reasonable default. All four strain metrics are available as data cells in the views builder.
Where to Find Everything
Build and manage views from the Tools tab. The editor lets you start from a template or a blank canvas, add panels, drag in fields from a searchable gallery, and reorder everything. Browse community views in the Discover tab. During a ride, your starred views appear in a dropdown in the player header—click the grid icon to switch without pausing.