
Build Your Own Data
The Widget Builder lets you create custom metrics from formulas, style them however you want, and use them during workouts. Read the full documentation.
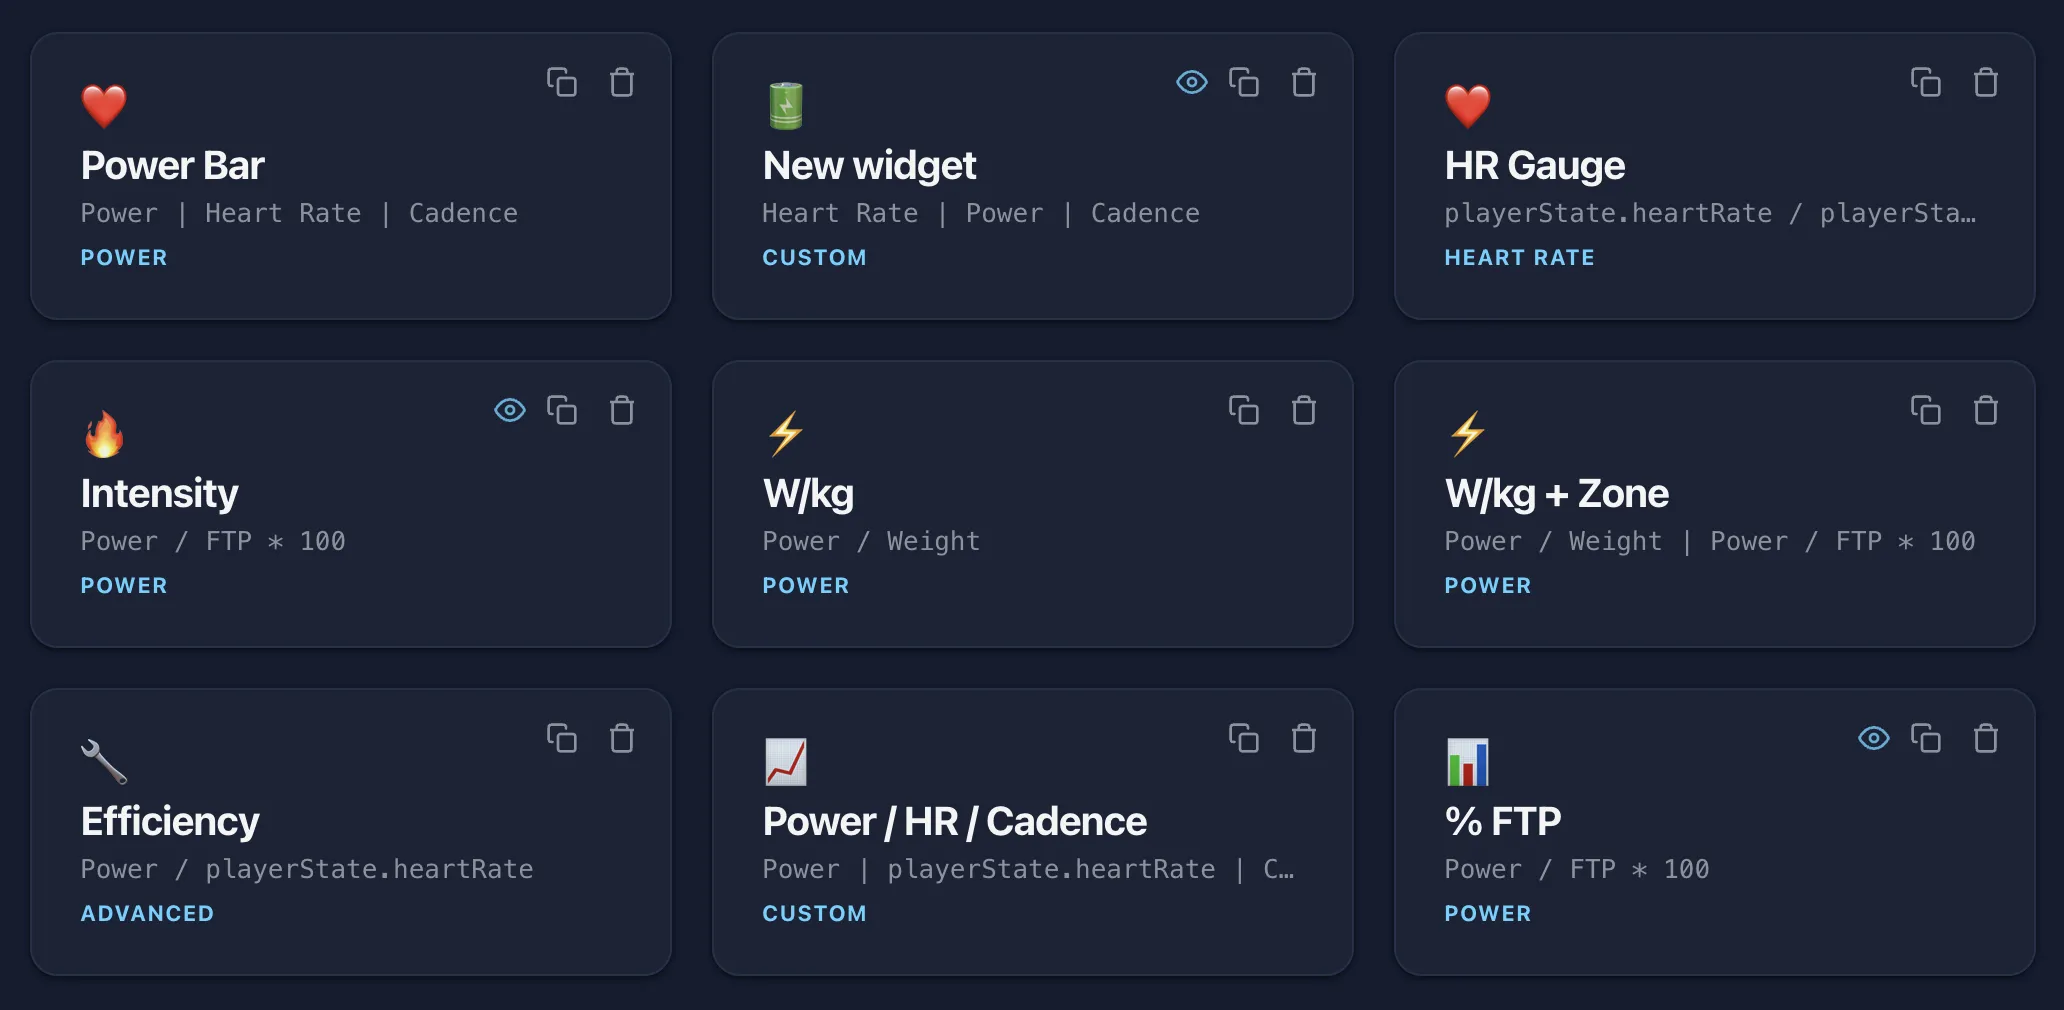
Ride Cave ships with dozens of built-in data items: power, heart rate, cadence, TSS, W'bal, and more. But every rider eventually wants something the defaults don't cover. Maybe you want a gauge that fills up as you approach your FTP. Maybe you want a colored indicator that turns red when your power-to-heart-rate ratio starts decoupling. Maybe your coach tracks a custom efficiency metric that no platform supports natively. Widgets let you build exactly the data item you need and display it during your workout. See the widgets documentation for a full reference.
What Widgets Are
A widget is a custom data item you create from a formula and display during your workout. It pulls from the same live session data that powers the built-in metrics: power, HR, cadence, speed, normalized power, peak powers, zone times, W'bal, strain, intervals, and more. Your formula runs against that data in real time.
Once saved, your widget appears in the View builder alongside everything else. Add it to any workout view, and it updates live during your ride just like a native metric. It's a first-class data item that happens to be defined by you.
The Formula System
Formulas use standard math: addition, subtraction, multiplication, division, and parentheses. Six functions are available: round(), abs(), floor(), ceil(), min(), and max(). You reference data fields by name. Type "Power" and it resolves to your current watts. Type "Peak 5m" and you get your best five-minute power from the session.
Over 65 fields are available, organized by source: live trainer data, session averages and peaks, power and HR zone times, W'bal, strain, interval stats, and profile values like FTP and weight. As you type, an autocomplete dropdown suggests matching fields so you don't have to memorize anything.
A few examples: Power / FTP * 100 shows current intensity as a percentage of threshold. NP / Avg Power calculates variability index on the fly. round((HR - 48) / (190 - 48) * 100) turns heart rate into a custom zone percentage. Formulas validate as you type with a green checkmark for valid and a red indicator for errors.
Display Types
A number on a screen is useful. A number that changes color when you cross a threshold is better. Widgets support five display types:
Number is the default: your computed value with an optional suffix like "w" or "%", with color thresholds that change the text color based on value. Bar renders a vertical fill bar toward a max value, with threshold-driven color changes. Gauge draws a ring that fills proportionally, useful for showing effort as a percentage of capacity. Indicator is a colored dot: green when you're in range, red when you're not. Text shows conditional labels instead of numbers, so the display can read "Easy" below 60% FTP and "Hard" above 90%.
Every display type supports threshold rules with five comparison operators. You define the breakpoints and colors, and the widget handles the rest.
Multi-Metric Widgets
A single widget can hold up to three metrics, each with its own formula, display type, and thresholds. This lets you build compound data items that group related information into one cell: power plus heart rate plus cadence in a single glanceable block, or a number on top with a gauge below it.
Templates and Preview
You don't have to start from scratch. The Widget Builder includes templates for common setups: percentage of FTP, efficiency factor, power gauge, intensity label, and more. Pick one and the formula, display type, and thresholds are pre-filled. Modify from there or use it as-is.
A live preview panel sits beside the editor and updates instantly as you change anything. It renders the actual widget against sample data, so you see exactly what it'll look like mid-workout. You can edit the sample values to test scenarios: what does the gauge look like at 300 watts versus 150? Adjust and see immediately.
Sharing with the Community
Widgets are private by default. If you build something useful, you can make it public. Public widgets appear in a community section of the View builder, available for anyone to add to their views.
The library of available data items grows over time as riders share what they've built. If someone creates a metric you've been wanting, use it without building your own. Want to tweak a community widget? Duplicate it into your personal collection and modify however you like.
Getting Started
Head to Tools and open Widgets. Create a new widget, pick a template or start blank, write a formula, choose a display type, and save. It shows up in your View builder immediately, ready to add to any workout view.
If you build something interesting, consider making it public. Every rider who shares a widget makes the platform more useful for everyone else.